Let's be honest. You've probably Googled "how to fix Core Web Vitals" at least three times this month. Every single result was either a wall of text that made your eyes glaze over, or some agency trying to sell you a $5,000 performance audit. You closed the tab. You went back to Slack. Nothing got fixed.
Here's the thing: fixing your vitals isn't complicated. The problem is that the internet is drowning in technical jargon written by people who've never had to actually explain this to a client who just wants the damn website to work.
So let's skip the preamble. This is what Core Web Vitals actually are, why Google cares, and what you do about it today, not next quarter.
- LCP: Why your site loads like it's on dial-up
- CLS: The thing that makes people click the wrong button
- INP: The metric Google is obsessed with now
- How to actually measure your scores
- The 80/20 fixes that solve most problems
- The PageSpeed 100/100 myth (please read this)
- Do Core Web Vitals actually affect rankings?
LCP: Why Your Site Loads Like It's on Dial-Up
LCP — Largest Contentful Paint
LCP is just a fancy way of asking: how long until I see the actual content I came here for? Not the nav bar, not the cookie banner, not the footer. Try our free CLS Visualizer to see shifts in real time. The main thing. The hero image, the headline, the product photo.
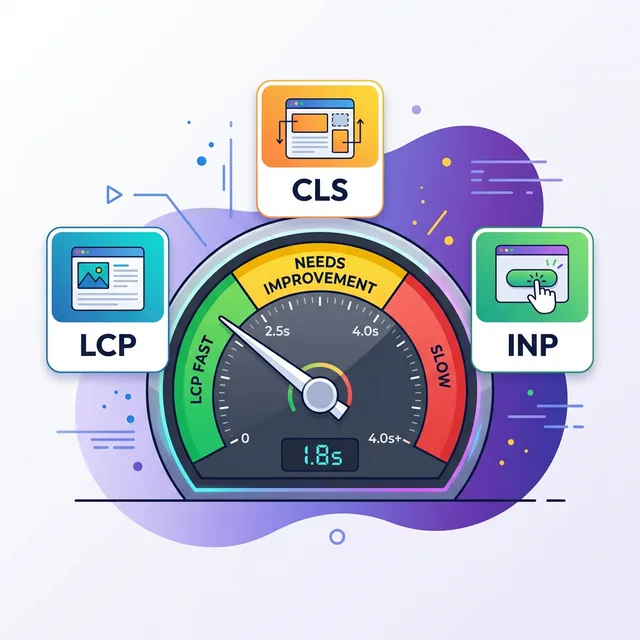
Google says 2.5 seconds is "good." 4 seconds is "needs improvement." Anything above that and you're in the red zone where people are already leaving and never coming back.
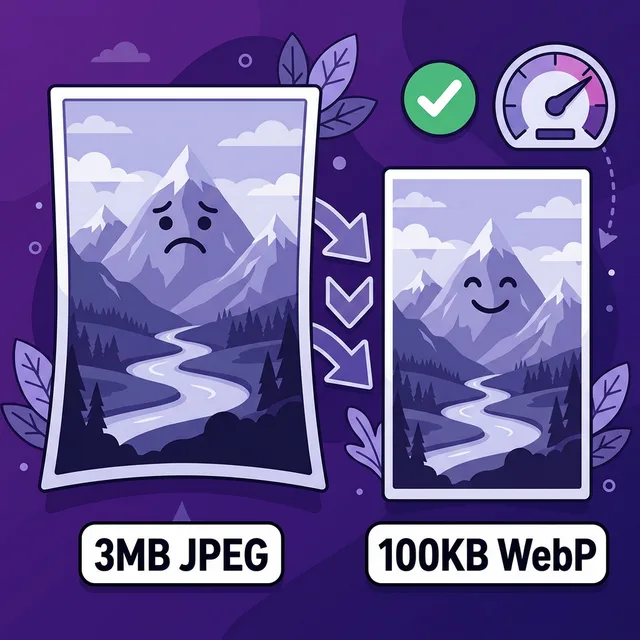
THE FIXCompress your hero image to WebP, under 150KB. Preload it. Remove render-blocking scripts from your head. This solves the overwhelming majority of bad LCP scores.
The biggest culprit? Almost always the hero image. Someone uploaded a 4MB PNG from Photoshop in 2021, nobody touched it since, and now the site takes 6 seconds to paint anything meaningful. I've seen this on e-commerce sites with real traffic. Six. Whole. Seconds. People leave after 3.
What actually causes bad LCP
In rough order of how often I see them:
- Uncompressed hero images. A 3MB JPEG where a 90KB WebP does the same job. Extremely common.
- No preloading of the LCP image. The browser doesn't start downloading it until it
finishes parsing HTML, which takes a while if scripts are blocking. Add
<link rel="preload" as="image" href="hero.webp">to your <head>. - Slow server response (TTFB). If it takes 800ms just to get the first byte of HTML from your server, you're already behind before a single image has loaded. Upgrade hosting or add a CDN.
- Render-blocking CSS and JS. Scripts in <head> load before the page can draw anything. Every synchronous script is a wall the browser must climb before showing users anything at all.
The good news: fixing #1 (hero image compression) alone moves most sites from red to at least yellow. It's genuinely that impactful. We wrote a whole image compression guide with exact tools and step-by-step instructions.
LCP targets
| Rating | Time | What it means |
|---|---|---|
| Good | Under 2.5s | Google is happy. Users are happy. Keep going. |
| Needs Work | 2.5s to 4s | You're leaving organic traffic on the table. |
| Poor | Over 4s | Fix this before you touch anything else. Seriously. |
CLS: The Thing That Makes People Click the Wrong Button
CLS — Cumulative Layout Shift
You're reading an article, you reach to click "Continue Reading," and suddenly an ad loads above the text and shoves everything down. You click "Buy Now" instead. You didn't want to buy anything. Congratulations, you're now the proud owner of a $49 cryptocurrency ebook from 2017.
That's CLS. It measures how much the page visually jumps around after it starts loading. Under 0.1 is good. Over 0.25 is genuinely bad and annoying.
THE FIXSet explicit width and height on every image. Reserve space for ads and embeds. Stop letting content pop in above other content.
CLS is the one that makes your site feel scammy even when you're not doing anything wrong. If the page jumps around like it's had three espressos, people don't trust you. It's a gut reaction. No amount of great copy fixes that first impression.
The three most common CLS causes
1. Images without defined dimensions. When an image loads without a width and height, the browser doesn't know how much space to reserve. So it loads the text first, then the image pops in and shoves everything down. The fix is embarrassingly simple:
<!-- Bad: browser has no idea how tall this is -->
<img src="hero.webp" alt="Hero">

<!-- Good: browser reserves exact space before image loads -->
<img src="hero.webp" alt="Hero" width="1200" height="630">
2. Ads and third-party embeds. Third-party ads are the single biggest CLS offenders on the web. They load late, they load at different sizes, they shove everything around. If you can't remove them, at least wrap them in a container with a fixed min-height matching the typical ad size.
3. Web fonts swapping in late. When a custom font finishes downloading, the browser swaps it
and text reflows. If the fallback font is radically different in size, this causes visible layout shift.
Fix: use font-display: optional or preload your fonts. Check our resource loading guide for how.
CLS under 0.1 is the target. Most sites fix this in an afternoon by just adding width and height attributes to images and reserving ad space. It really is that fast.
INP: The Metric Google Is Obsessed With Now
INP — Interaction to Next Paint
INP replaced First Input Delay (FID) in March 2024. It doesn't just measure the first click on a page. It watches every single interaction throughout your whole visit and measures how long until the page visually responds.
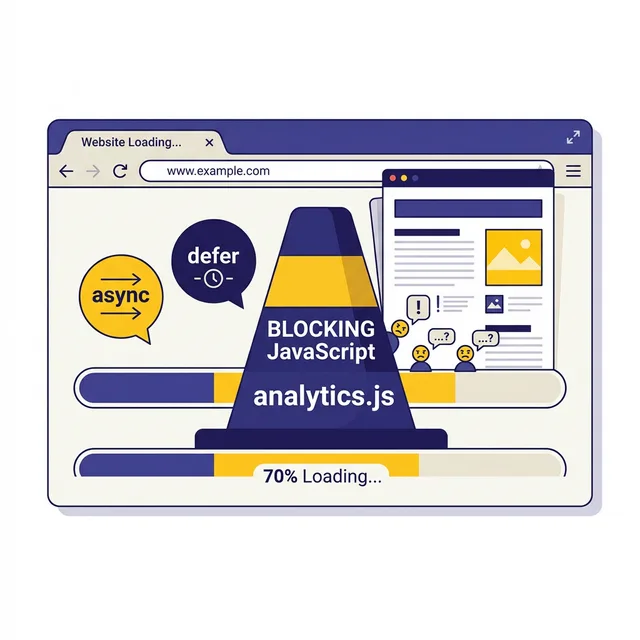
Under 200ms is good. Over 500ms is poor. And bad INP is almost always JavaScript's fault.
THE FIXAudit your plugins ruthlessly. Defer everything that can wait. Delete everything you're not actively using. Every unnecessary script is stealing milliseconds from user interactions.
Think of INP like pressing a button in an elevator and measuring how long until the floor light actually turns on. FID only measured the very first button press. INP watches every press, every floor, the whole ride. Stricter, and it catches problems FID completely missed.
The most common causes of bad INP:
- Long JavaScript tasks on the main thread. If JS is running a loop that takes 300ms, no
user interactions can be processed during that time. Break long tasks into smaller chunks using
setTimeout()or the Scheduler API. - Too much JavaScript, full stop. A WordPress site with 25 active plugins probably runs 600KB-plus of JS on every page. Most of that is doing essentially nothing useful for the visitor.
- Third-party scripts. Live chat widgets, A/B testing tools, heatmap recorders, marketing
trackers. All execute JavaScript on your users' devices, on your clock. Load them with
deferor only on pages that actually need them.
The full fix is in our defer JavaScript guide. Short version: defer everything you don't need immediately, delete everything you haven't used in 90 days.
How to Actually Measure Your Scores
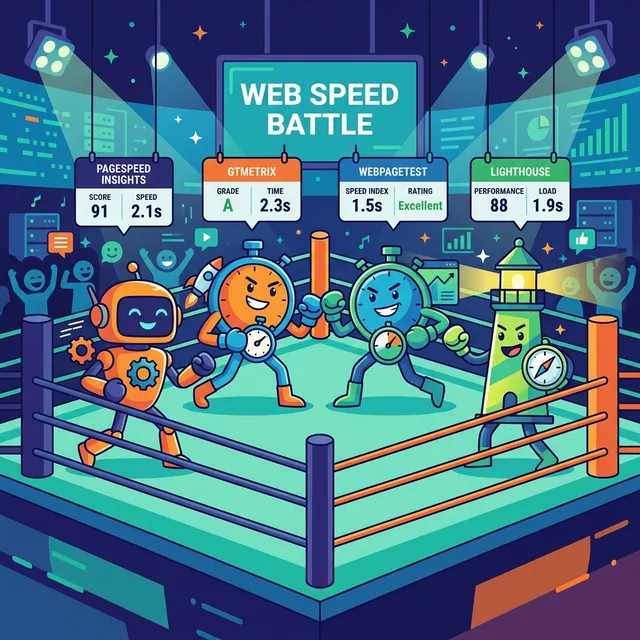
Before you fix anything, get a baseline. Here are the tools worth using, in order of usefulness:
VitalsFixer (free) — Run your URL, get a prioritized punch-list of what's broken. No waterfall charts, no academic jargon. Just "this image is 3MB, make it 90KB." Try it now.
Google PageSpeed Insights (free) — The source of truth since it's what Google uses. Shows both lab data (simulated) and field data (real users). Field data is more important. Lab data is for diagnosing specific issues.
Google Search Console (free) — Under "Core Web Vitals" in the sidebar, you'll see your actual field data grouped by URL. This is real-user data from Chrome browsers. This is what actually affects rankings. Check it monthly.
WebPageTest (free) — Better for deep debugging. Excellent filmstrip view shows exactly when each element loads. Use this when you need to understand the "why" behind a specific bad score.
One critical distinction: lab scores and field scores can differ significantly. Lab scores use a simulated slow device with throttled connection. Field scores reflect what your actual visitors experience. Google ranks you based on field data. So if your lab score is 45 but field data is "Good," you're actually fine from a ranking standpoint, even if that 45 looks scary.
Read our full tool comparison for a detailed breakdown of each option and when to use which.
The 80/20 Fixes That Solve Most Problems
After auditing a lot of sites, the same problems come up again and again. Here's where to start:
Do These First
These five things fix the majority of Core Web Vitals problems on most websites.-
1
Compress your hero image to WebP. Your hero image is probably the single biggest opportunity on your site. Convert to WebP, resize to the actual display dimensions, and get under 150KB. This alone moves most sites from red to green on LCP. Full guide at compress-images.
-
2
Add width and height to every image tag. Takes maybe 10 minutes on a typical site. Fixes CLS for most people. While you're at it, add
loading="lazy"to any image that doesn't appear above the fold. Our lazy loading guide covers exactly how to do this. -
3
Delete unused plugins and scripts. Open your browser's Network tab, sort by size, look at what's loading. Scripts from tools you stopped using 18 months ago should be removed. Every 100KB of JavaScript you remove is a measurable improvement in INP and LCP.
-
4
Defer non-critical JavaScript. Any script that doesn't need to run before the page renders should have
deferorasync. Analytics scripts, live chat widgets, social share buttons — none of those should block rendering. See the full defer JavaScript guide. -
5
Check your hosting's TTFB. If Time to First Byte is over 800ms, image compression alone won't get you there. Cheap shared hosting is often the silent killer of good Core Web Vitals. A CDN or better server is sometimes the most impactful single fix.
WordPress-specific quick wins
If you're on WordPress, here's the fastest path:
- Install a caching plugin (WP Rocket or W3 Total Cache) and enable page caching, minification, and lazy loading.
- Check your theme's loading footprint. Some premium themes load 400KB of CSS for features you've never even enabled.
- Disable any plugin you haven't actively used in 6 months. Seriously, just go do it right now.
- Use Cloudflare's free plan to speed up global asset delivery. Takes 20 minutes to set up.
Not on WordPress? Same principles apply. Replace "plugin" with "npm package" or "third-party script." The concept is identical.
The PageSpeed 100/100 Myth (Please Read This)
Every so often someone posts a screenshot in a dev forum: "Got 100/100 on PageSpeed! My site is perfect!" Everybody claps. I quietly go back to my coffee because... that's not how this works.
PageSpeed Insights lab scores are not what Google uses for ranking. What matters is your Core Web Vitals field data. Specifically, what percentage of your real users experience "Good" scores for LCP, CLS, and INP.
You can have a PageSpeed score of 65 and rank absolutely fine, if your actual visitors see fast load times. You can have a score of 92 and still fail Core Web Vitals if real-world mobile users see slow LCP. I've seen both happen.
The lab score is a useful diagnostic tool. It is not the finish line. Stop chasing 100 and start checking your Google Search Console Core Web Vitals report instead. That's the data that actually moves your ranking.
Also worth mentioning: a score of 100 on a page with no real content is trivially easy to achieve. A blank HTML file will score 100. That's useless. The goal is a fast, functional website for real users, not a number on a simulated test.
Do Core Web Vitals Actually Affect Rankings?
Short answer: yes, but not the way most people think.
Google confirmed in 2021 that Core Web Vitals are a ranking signal through the "Page Experience" update. But they've been equally clear that content quality is still the primary factor. A well-researched article on a slightly slower site will often outrank thin content on a blazing-fast one.
Here's the more nuanced real-world picture: Core Web Vitals act as a tiebreaker. When two pages are roughly equal in content quality and relevance, the faster one tends to rank higher. And in competitive query spaces, that tiebreaker matters a lot.
There's also a very real indirect effect. Slow sites have higher bounce rates. Higher bounce rates mean fewer pages crawled, less dwell time, worse engagement signals. All of those affect rankings independently of the Page Experience signal itself.
So: fix your vitals not just because Google told you to, but because fast sites convert better, keep people on the page longer, and make ranking easier. The explicit ranking signal is almost a bonus at this point.
Google doesn't rank you on a score. They rank you on whether or not you're annoying their users. If your vitals are red, you're invisible. If they're green, you've got a seat at the table.
The Bottom Line
Core Web Vitals are not rocket science. They're not some dark mystery requiring a $10,000 agency retainer. They're mostly:
- Images that are too big. Compress them.
- Scripts that are blocking the page. Defer them.
- Elements without dimensions. Add width and height.
- Too much JavaScript running at once. Delete some of it.
Fix those four things and you'll solve the vast majority of Core Web Vitals problems on the vast majority of websites. The complex edge cases exist, but they're not where you start.
Start with your hero image. It's almost always the biggest win.
Ready to See What's Actually Broken?
Put your URL into VitalsFixer and get a punch-list of exactly what needs fixing. No nonsense, no waterfall charts.
Analyze My Site Free