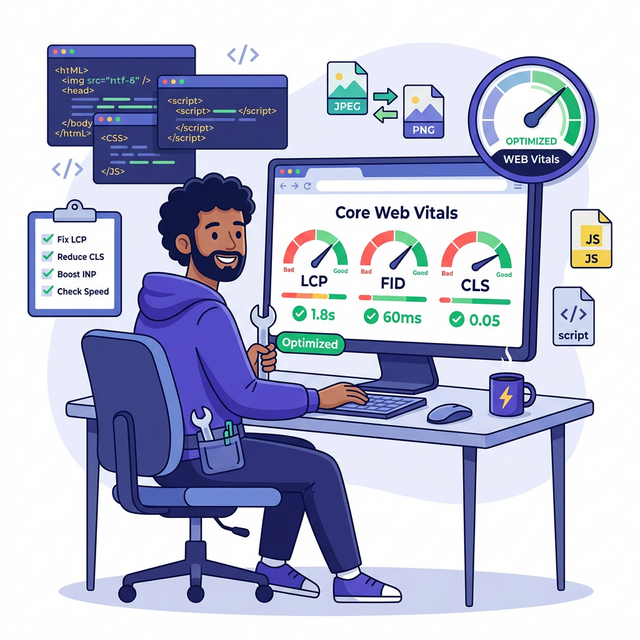
Let's not sugarcoat it. Core Web Vitals are annoying. You run PageSpeed Insights, it tells you your LCP is "Poor" and your CLS is "Needs Improvement," and then hands you a list of suggestions written like a terms-and-conditions doc. So you close the tab and pretend the problem doesn't exist for another three weeks.
This guide is different. It tells you exactly what to fix, in what order, with actual code you can copy and paste. No "minimize your critical request chains" without explaining what that means. Just real fixes.
Run a Proper Baseline Audit
Before touching anything, take a screenshot of your current scores. You'll need this to prove to yourself (and anyone else) that you actually made progress. Also, it's deeply satisfying to look back at your old 23/100 mobile score once you're sitting at 84.
Go to pagespeed.web.dev, paste your URL, run the test. Do this three times and average the scores — PageSpeed has variance and a single run can be misleading.
What to look for in your report
Focus on three sections in order of importance:
- The LCP element — PageSpeed shows you a screenshot pointing to exactly which element is your LCP. Usually your hero image or an H1. This is your first target.
- Opportunities section — These are actionable fixes with estimated time savings. Sort by biggest saving.
- Diagnostics section — Deeper issues. Check "Reduce unused JavaScript" and "Avoid enormous network payloads."
💡 Use VitalsFixer for a more detailed breakdown
PageSpeed gives you the score. Running your URL through VitalsFixer gives you a prioritized list of exactly what to fix first, with difficulty ratings and estimated impact. Free to use.
Also run the Chrome DevTools Coverage tool (F12 → three-dot menu → Coverage) to see how much of your JavaScript and CSS is actually used on the page. Unused code over 60% is a red flag worth addressing.
Fix Your LCP — The Single Biggest Win
LCP measures how long it takes for the largest visible element (usually your hero image or main headline) to load. Google considers anything over 2.5s as "Poor." Most sites start at 4-8s on mobile.
The good news: LCP is the easiest metric to dramatically improve in a short time. Here's the order of fixes, highest impact first.
Fix 1: Compress and convert your hero image to WebP
A 2MB JPEG hero image loading on a phone with an average mobile connection takes 3-5 seconds by itself. That's your entire LCP budget, gone on a single image file. The fix:
- Go to squoosh.app (free, runs in browser)
- Upload your hero image
- Select WebP as the output format
- Set quality to 75-80 (looks identical to 100%, costs a fraction of the file size)
- For a 1200px-wide hero, target under 80KB. For a 1920px hero under 120KB.
Replace the old image file on your server. WebP typically reduces image size by 25-35% compared to JPEG and 60-70% compared to PNG, with no perceptible quality loss.
Fix 2: Add fetchpriority="high" to your hero image
The browser doesn't know your hero image is the most important thing to load. Tell it explicitly:
<!-- Before: browser treats this like any other image -->
<img src="hero.webp" alt="..." width="1200" height="630">

<!-- After: browser gives it maximum download priority -->
<img src="hero.webp"
     alt="Your descriptive hero image alt text here"
     width="1200" height="630"
     loading="eager"
     decoding="async"
     fetchpriority="high">
Fix 3: Preload the hero image in your <head>
Even better than fetchpriority — tell the browser before it even gets to parsing the body:
<!-- Add this in <head>, before any stylesheets -->
<link rel="preload" as="image" href="/images/hero.webp"
      fetchpriority="high">
This instructs the browser to start downloading it the moment it reads the head — before CSS, before scripts, before anything else. It's the single most effective LCP optimization for image-based LCP elements.
⚠️ Never lazy load your hero image
loading="lazy" on your hero is the most common LCP self-sabotage. It tells the browser to delay loading the most important image. If any plugin added lazy loading to all images site-wide, override the hero manually with loading="eager".
Fix 4: Move hero image server-side rendered (not JavaScript injected)
If your hero image URL is set by JavaScript — like when a background image is loaded via a JS carousel or a React component — the browser can't discover and start downloading it until after JS executes. That adds 500ms-2s to LCP before the download even begins. The fix is to ensure the hero image exists in HTML server-side, not injected by JavaScript after parse.
| LCP Fix | Effort | Impact |
|---|---|---|
| Convert hero to WebP under 80KB | Easy | High — often saves 1-3s |
| Add fetchpriority="high" | Easy | Medium — saves 200-600ms |
| Preload <link> in <head> | Easy | High — consistent early discovery |
| Remove lazy loading from hero | Easy | Critical if currently applied |
| Move hero to SSR HTML | Hard | High for JS-heavy frameworks |
Defer Your JavaScript — Free INP Points
Every <script> tag in your HTML head without defer or async
stops the browser from building the page entirely. It has to download the script, parse it, run it, then
continue. If you have four analytics/chat/tracking scripts loading this way, users are staring at a
blank page while your marketing tools load.
The one-line fix for most scripts
<!-- Before: blocks page render completely -->
<script src="analytics.js"></script>
<script src="chat-widget.js"></script>
<script src="heatmap.js"></script>

<!-- After: runs after HTML is parsed, doesn't block -->
<script src="analytics.js" defer></script>
<script src="chat-widget.js" defer></script>
<script src="heatmap.js" defer></script>
Use defer for most scripts (respects load order). Use async for completely
independent scripts like Google Analytics gtag that don't depend on anything else.
Lazy-load heavy widgets on user interaction
Chat widgets, heatmap recorders, and video embeds can load hundreds of kilobytes of JavaScript. There's no reason this needs to happen before the user interacts with your page:
// Load chat widget only after user shows intent to engage
let chatLoaded = false;
function loadChatWidget() {
    if (chatLoaded) return;
    chatLoaded = true;
    const s = document.createElement('script');
    s.src = 'https://your-chat-provider.com/widget.js';
    s.async = true;
    document.head.appendChild(s);
}
// Trigger on first interaction — scrolling, moving, touching
document.addEventListener('scroll', loadChatWidget, {once: true});
document.addEventListener('mousemove', loadChatWidget, {once: true});
document.addEventListener('touchstart', loadChatWidget, {once: true});
The widget still loads fast — usually within a second of scrolling — but it doesn't compete with LCP resources during the critical initial load window.
Kill Layout Shift — Fix Your CLS
CLS (Cumulative Layout Shift) is the score that measures how much your page "jumps around" as it loads. You know when you're about to tap a button and an ad loads above it, moving everything down and you accidentally click the wrong thing? That's CLS. Google hates it. Users hate it more.
Fix 1: Always specify width and height on images
When a browser loads an image without dimensions, it doesn't know how much space to reserve. The page renders, then the image loads and shoves everything down. One attribute change fixes this:
<!-- Causes layout shift — browser has no idea how tall this is -->
<img src="photo.webp" alt="Product photo">

<!-- No layout shift — browser reserves 800x600px immediately -->
<img src="photo.webp" alt="Product photo"
     width="800" height="600"
     loading="lazy" decoding="async">
You don't need to set the exact display size — just the aspect ratio. If your image is 16:9, use
width="1600" height="900" or width="16" height="9". The browser uses this to
calculate space before the image arrives.
Fix 2: Reserve space for ads and embeds
Ads that inject dynamically are a massive CLS source. If you can't control when the ad loads, at least control the space it occupies:
/* Reserve ad space before it loads */
.ad-slot {
    min-height: 250px; /* typical banner height */
    background: #f8fafc; /* subtle placeholder */
    display: flex;
    align-items: center;
    justify-content: center;
}
Fix 3: Don't inject content above existing content
Cookie banners, notification prompts, chat bubbles, "install our app" banners — if these slide in above your content rather than overlaying it, they shift everything down. Make sure these appear in fixed or sticky positioned containers that don't affect document flow, or are part of the initial render rather than injected after.
Fix 4: Font flash (FOUT) and CLS
If your custom font loads late and causes text to reflow (especially if the fallback font is a different size), it can add to CLS. Fix with font-display: swap and size-adjust:
@font-face {
    font-family: 'YourFont';
    src: url('/fonts/yourfont.woff2') format('woff2');
    font-display: swap;
    /* Use size-adjust to match fallback font metrics */
    size-adjust: 105%;
    ascent-override: 90%;
}| CLS Fix | Type | Impact |
|---|---|---|
| Add width + height to all images | Easy | Usually halves CLS score on image-heavy sites |
| Reserve ad slot space with min-height | Easy | Eliminates ad-driven layout shift |
| Fix cookie/notification banners | Medium | Often significant — banners are huge CLS sources |
| Font-display: swap + size-adjust | Medium | Minor-medium depending on font difference |
Fix Long Tasks — Fix INP Properly
INP measures how quickly your page responds to user interactions like clicks and keyboard input. A bad INP usually means the main thread is busy with long JavaScript tasks when the user tries to interact — so their input sits waiting in a queue.
Find your long tasks
Open Chrome DevTools → Performance tab → click Record → interact with your page (click buttons, scroll, type) → stop recording. Look for red bars at the top of tasks in the main thread row. Red = over 50ms. Click them to see which function caused them.
Break up long tasks with yielding
If you have a function that runs for 200ms (common in data processing or rendering), break it into smaller chunks that yield control back to the browser between each chunk:
// 200ms blocking task — bad for INP
function processAllItems(items) {
    items.forEach(item => expensiveOperation(item));
}

// Same work, but yields every 50 items — browser can handle clicks between chunks
async function processAllItems(items) {
    for (let i = 0; i < items.length; i++) {
        expensiveOperation(items[i]);
        if (i % 50 === 0) {
            // Yield to browser — allows interaction processing
            await new Promise(r => setTimeout(r, 0));
        }
    }
}
Remove or defer heavy third-party scripts
A/B testing scripts (Optimizely, VWO), heatmap recorders, marketing automation tags — each one adds execution time to the main thread. Use the lazy-loading pattern from Step 3 for any widget that isn't needed in the first 5 seconds. Each heavy script you defer or remove is a direct INP improvement.
✅ Check Google Search Console for INP data
Google Search Console → Core Web Vitals → INP shows you which specific pages have poor INP from real field data (actual Chrome users). This is more accurate than lab data. Fix the worst pages first.
WordPress-Specific Fixes
WordPress gets a reputation for being slow, and honestly — it deserves it. But the site isn't inherently slow. It's the 34 plugins and the unoptimized theme that make it slow. Here's how to fix it without rebuilding everything from scratch.
Plugin 1: WP Rocket (paid, worth it)
WP Rocket handles image lazy loading, JavaScript deferral, critical CSS generation, caching, GZIP compression, and preloading in one plugin. If you only install one paid performance plugin, make it WP Rocket. Enable these settings specifically:
- File Optimization → Delay JavaScript execution
- Media → Enable LazyLoad for images (but add your hero image CSS selector to exclusions)
- Preload → Preload links
Free option: Flying Press or Perfmatters
Perfmatters is cheaper than WP Rocket and excellent for disabling scripts per-page (so your contact form JS doesn't load on your homepage). Flying Press has good critical CSS generation and JS deferral for free.
Fix the WordPress hero image lazy-loading trap
WordPress 5.5+ automatically adds loading="lazy" to all images, including your hero.
Override it in your theme's template file:
<?php
// In your theme's template (single.php, front-page.php, etc.)
the_post_thumbnail('full', array(
    'loading'       => 'eager',
    'fetchpriority' => 'high',
    'decoding'      => 'async',
    'width'         => '1200',
    'height'        => '630',
));
?>
Dequeue unused scripts
Every WordPress plugin loads its JS on every page whether it's needed or not. Use Perfmatters or add this to your functions.php to dequeue scripts on pages that don't need them:
// Remove contact form 7 scripts from non-contact pages
add_action('wp_enqueue_scripts', function() {
    if (!is_page('contact')) {
        wp_dequeue_script('contact-form-7');
        wp_dequeue_style('contact-form-7');
    }
}, 99);
Database and server: quick wins
- Enable GZIP/Brotli compression on your server or through Cloudflare. Reduces HTML/CSS/JS transfer size by 60-80%.
- Enable server-side caching. WP Rocket does this. So does WP Super Cache (free). Cached pages serve in <100ms vs 400-1200ms for uncached PHP.
- Use a CDN. Cloudflare free tier puts your static assets on servers physically closer to your users. Alone, this can shave 200-500ms off LCP for international visitors.
🛠 The Master DIY Checklist
- 1
Compress hero image to WebP under 80KBUse Squoosh.app free. WebP at 75-80% quality = smaller file, same visual.
- 2
Add fetchpriority="high" to LCP imageTells the browser to download it first. Single attribute, measurable LCP gain.
- 3
Add <link rel="preload"> for hero in <head>Browser discovers the image before anything else loads.
- 4
Add defer or async to all non-critical scriptsAnalytics, chat, tracking, heatmaps, social buttons — all of them can defer.
- 5
Add width + height to every image tagEliminates the #1 CLS cause. Prevents layout shift as images load in.
- 6
Reserve ad slots with min-height CSSAds that inject without reserved space cause major layout shifts.
- 7
Lazy load all images below the foldAdd loading="lazy" to everything that isn't visible without scrolling.
- 8
Compress all images site-wide (not just hero)Large product/blog images add weight even when lazy loaded.
- 9
Delete plugins and scripts you no longer useEvery dead plugin is a JS/CSS payload with zero benefit. Audit and delete.
- 10
Enable GZIP/Brotli + server cachingCloudflare free tier handles CDN + compression. WP Rocket handles caching.
- 11
Check long tasks in DevTools Performance tabAny task over 50ms hurts INP. Identify and either remove or break them up.
- 12
Re-run PageSpeed 3×, average your scores, compare to baselineCelebrate the wins. Then request re-indexing in Google Search Console.
What to Expect After Doing All of This
If you're starting from a typical slow site (LCP 5-8s, CLS 0.2-0.5, INP 300-600ms), working through this full checklist typically produces:
| Metric | Before (typical) | After (typical) | Change |
|---|---|---|---|
| LCP | 5.2s | 2.0s | −61% |
| CLS | 0.28 | 0.05 | −82% |
| INP | 480ms | 160ms | −67% |
| PageSpeed Mobile | 28/100 | 74/100 | +46 points |
| PageSpeed Desktop | 55/100 | 91/100 | +36 points |
Google's CrUX data (what actually affects rankings) updates after 28 days of Chrome user field data. So after making these fixes, expect to see ranking improvement 4-6 weeks later once the field data reflects the improvements.
You tried. It's still red. That's normal.
Look, this guide covers what you can realistically fix yourself. But some problems go deeper. Server-side rendering issues, bloated JavaScript bundles, framework hydration bottlenecks, CDN misconfigurations, third-party scripts you can't control. Those aren't DIY territory. Our engineers spend their entire day doing exactly this. They've probably seen your exact issue on 50 sites before yours.
One-time fix starts at $99. If your scores don't improve, you get every dollar back. That's the whole deal.
See Expert Fix Plans →